| HomeTurtlegraficsGPanelRobotics WebTigerPython |
| Python - Online |
| Deutsch English |
1. The graphics window
![]()
YOU LEARN HERE... |
import the GPanel library and create a global graphics window with freely selected coordinates. |
EXAMPLES |
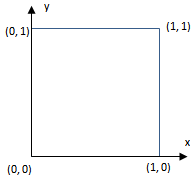
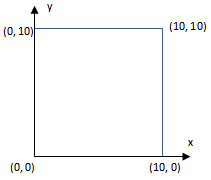
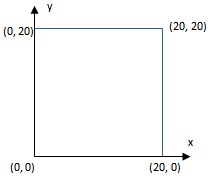
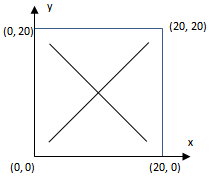
makeGPanel() creates a global graphics window with x- and y-coordinates from 0 to 1. makeGPanel(xmin, xmax, ymin, ymax) creates a graphics window with user-defined coordinates (floats), i.e. the user can freely define the axes of the coordinate system in the graphics window with these four parameters. The command line(x1, y1, x2, y2) draws a line from the point (x1, y1) to the point (x2, y2).
|

REMEMBER YOU... |
You can use any whole or decimal numbers as coordinates. Python is case-sensitive. Keywords and commands are written with a lowercase initial letter. Comments are introduced with #. |
TO SOLVE BY YOURSELF |
1) |
|
 |
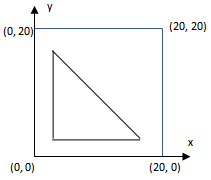
2) |
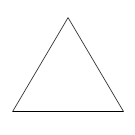
Select the same Gpanel window and draw three lines to create a right-angled triangle. |
 |
![]()