| HomeTurtlegraficsGPanelRobotics WebTigerPython |
| Python - Online |
| Deutsch English |
2. Shapes and colors
![]()
YOU LEARN HERE... |
The GPanel module has many graphic functions with which you can draw geometric shapes. Here are the most important commands:
|
EXAMPLES |
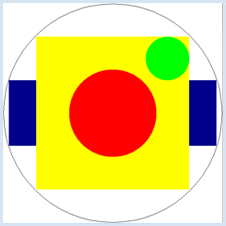
For figures that do not have coordinates, you must first define the position of the center point with pos(x, y). The invisible graphic cursor is located at point (0, 0) by default. The functions listed above do not change the position of the graphics cursor. The current drawing color is set with the command setColor(“color”), GPanel knows the so-called X11 colors. There are several dozen color names that can be looked up on the Internet at https://www.w3schools.com/colors/colors_x11.asp nachschlagen kann (z.B. "red", "yellow", "blue", "green", "magenta", usw.). Die Farbe kann auch mit dem Befehl setColor(r, g, b) gesetzt werden, wobei r, g, b ganze Zahlen zwischen 0 und 255 sind (RGB-Farbkomponenten). Eine hellgrüne Farbe erhält man z. B. mit setColor(0, 255, 0). Example 1: Circles and rectangles in different colors Program:
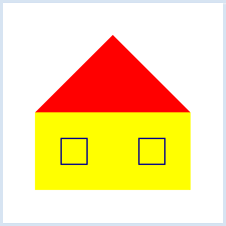
Program:
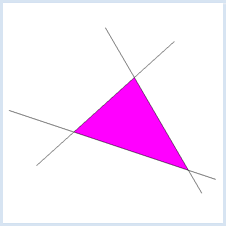
Example 3: Filling a closed figure Program:
|
REMEMBER YOU... |
You can look up the correct syntax of the graphic commands in the Documentation at any time. You can also find a link to the documentation in the WebTigerJython editor under Menu. The invisible graphics cursor is located in the point (0, 0) by default. With the command pos(x, y) you can move it to any position in the graphics window. |
TO SOLVE BY YOURSELF |
1) |
|
 |
2) |
Draw a Swiss cross. |
 |
3) |
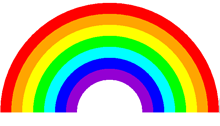
Draw a rainbow. Use the command fillArc(r, startangle, endangle). |
 |
![]()