|
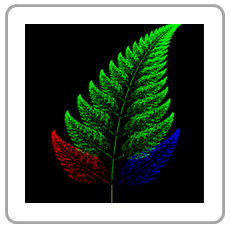 |
| Click on the picture! |
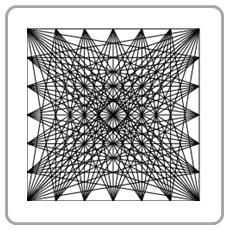 |
| Click on the picture! |
|
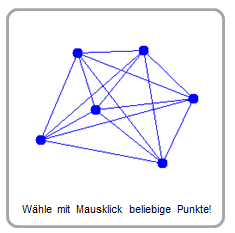 |
| Click on the picture! |
| Deutsch English |
| GPANEL (Coordinate graphics) |
|
|
|
The gpanel graphics library is very suitable for computer graphics, displaying functions and visualizing of simulations. In contrast to turtle graphics, where the graphics are created as traces of the moving turtle, here graphics are created with the help of coordinates and geometric shapes. You will learn the most important programming concepts with executable examples and many tasks that you can solve yourself. You can easily edit the programs created online with the locally installed TigerJython (Coordinate grafics with TigerJython). |
| Version 2, Last update: 10.Oct 2024 |