| Deutsch English |
The examples in this chapter can currently only be run using https://temp.webtigerpython.ethz.ch/.
YOU WILL LEARN... |
how to use the additional module mbsensor to display measurement data from the micro:bit sensors graphically and export the data as a CSV file for further processing on your computer. |
VISUALIZING ACCELEROMETER DATA |
|
|
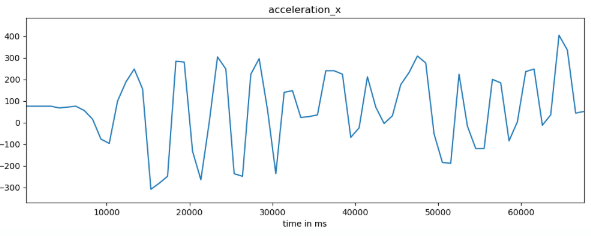
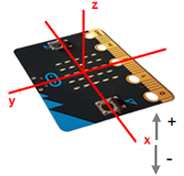
Program: from microbit import * from mbsensor import * repeat: logged_accelerometer.get_x() sleep(200) If your micro:bit is connected to your computer via a USB cable while the program is running, the x values are continuously displayed in the WebTigerPython graphics window, both as a graph in a coordinate system and in a table. You can stop the measurement by clicking the Disconnect device icon
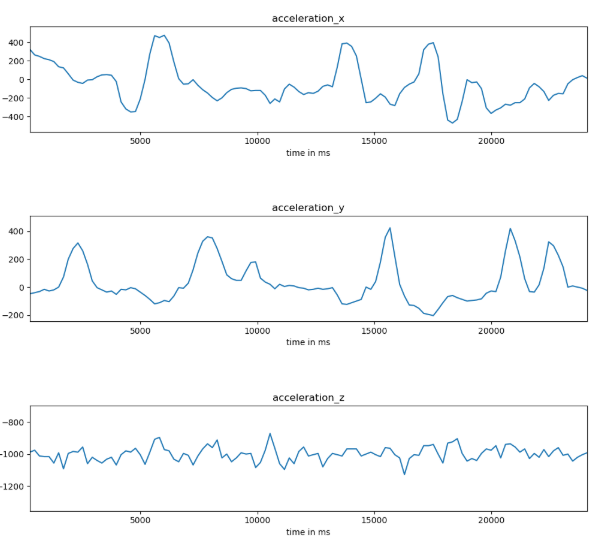
With the command logged_accelerometer.get_values(), you can visualize all three measured values simultaneously. Program: from microbit import * from mbsensor import * repeat: logged_accelerometer.get_values() sleep(200)
|
EXPORTING MEASUREMENT DATA AS A CSV FILE |
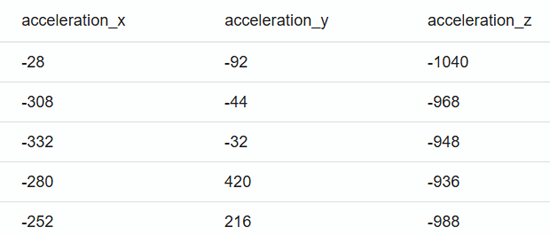
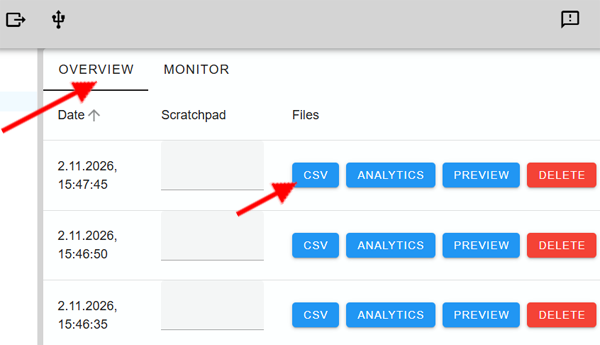
Run the previous program again. By default, the MONITOR view is selected, where the data is displayed graphically. Click OVERVIEW to access additional functions. By clicking CSV, you can save the measurement data in CSV format to a directory of your choice on your computer. The data can then be processed further, for example using Excel. Click PREVIEWto inspect the data before exporting it. You can delete data series that you no longer need by clicking DELETE.
|
REMEMBER... |
| The mbsensor module provides an easy way to visualize sensor data from the micro:bit. With the command logged_accelerometer.get_values(), you can display the measured values of the accelerometer graphically. Commands for supporting additional micro:bit and mbRobot sensors can be found in the documentation. The sensor data can be saved on your computer in CSV format and processed further, for example using Excel. |
ZUM SELBST LÖSEN |
|
 |
 |
 |

 .